MARKET NEED

Data analysis is an increasingly important task for industry; one they must typically perform before making a business decision. Linear and logistic regression are commonly used as predictive data analytic models.
The key characteristics of a regression model are:
- the regression weights, also known as regression coefficients, regression estimates or parameter estimates,
- the sign of each weight,
- a statistical significance associated with each weight.
These characteristics are associated with the model’s features and interaction features (i.e. interaction terms or combined features for the purposes of regression).
ModelVis is a regression model visualisation system that provides an intuitive understanding of how these three characteristics for each feature (i.e. predictor) contribute to the overall outcome of the regression model (i.e. the prediction output or the target).
The ModelVis system seeks to solve the problem of communicating regression results to a non-technical audience.
TECHNOLOGY SOLUTION

Figure 1. ModelVis’ web interface for generating a regression model
ModelVis is an easy-to-use and easy-to-understand web-based interface for visualising regression results.
Users can key in their regression models through a web form or upload them as a CSV file. Alternatively, users can upload their cleaned data as a CSV file to develop their regression model via
ModelVis’ embedded statistical tool as shown in Figure 1.
ModelVis displays regression model characteristics via an interactive force-directed graph, that is easy for a non-technical audience to understand, as shown in Figure 2. Each feature appears as a circle. The circle radius represents the feature weight, i.e. the feature’s impact on the target. The sign of each weight is depicted by the circle colour. The statistical significance is mapped to 5 levels of reliability, represented by the distance and the style of the line linking a feature to the target, as detailed in Figure 3.
ModelVis helps users to compare models by highlighting the most important differences through the visualisation.
The system has been designed using a combination of JavaScript, D3 JavaScript, JQuery JavaScript, Bootstrap, CSS and HTML.
ModelVis can be used to visualise any regression model.
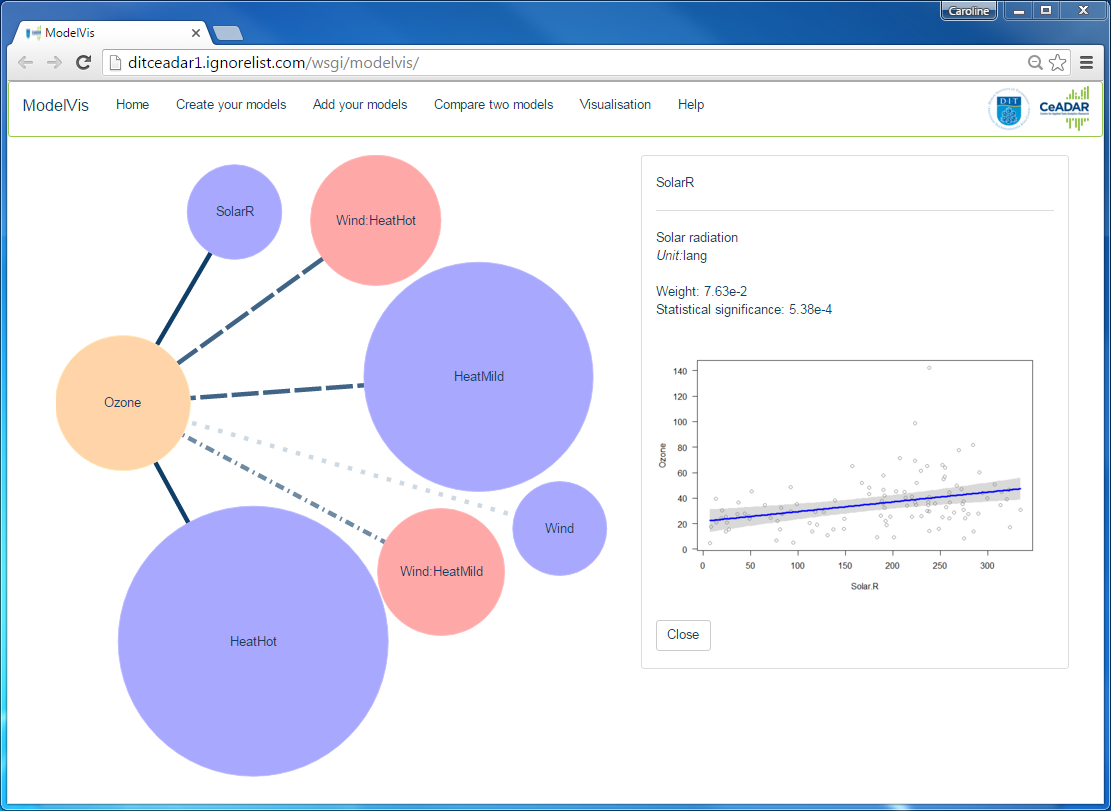
Figure 2. ModelVis’ web interface for visualising a regression model
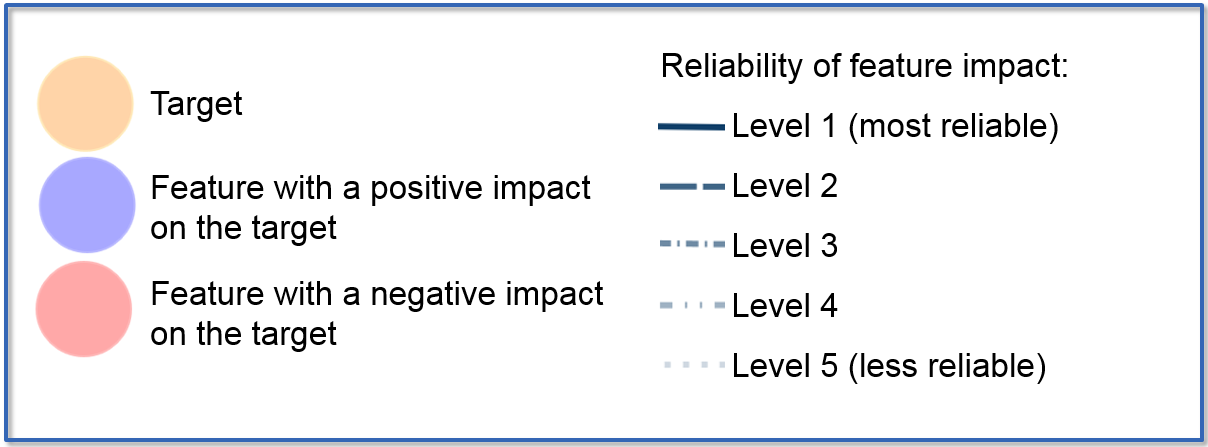
Figure 3. ModelVis’ legend
RESEARCH TEAM
- Dr. Caroline Maillet, Dublin Institute of Technology
- Dr. John D. Kelleher, Dublin Institute of Technology